


Back-Testing: The Trading Template
Up, Down or Flat? That's right, it's the Line Of Change.

I’m going to preface this post with: I’m in no way affiliated with this course, I’m just going through my course list and letting others know what it’s like in practice, by using back-testing as a means to affirm whether or not that the content is valuable.
Mike reiterates what a lot of other good traders, like No Nonsense Forex and ICT mention, but in a way that is memorable and non-technical to the layman.
Some of his terminology may sound gimmicky, but it’s used in a context to allow it to stick. His methodology seems sound, and he’s often seen with his live account, which many traders seem to avoid doing.
Good traders agree that sometimes, Markets don’t perform or act like they’re supposed to and believe that perhaps alogrithms or outside manipulation occurs. Mike also subscribes to this belief.
Do I subscribe to this belief? It’s hard not too, knowing what big tech is capable of. A good example of this is the documentary ‘The Social Dilemma’.
With that out of the way, I’m in no way an expert (yet), but below are my thoughts and attempts at back-testing Mikes methodology.
******
I used the Trading View basic plan, as it was free… and also because Meta Trader is an ugly piece of shit. I really want to use Meta Trader for back-testing, but come on guys… it’s really, really fucking ugly.
Below I’ll briefly break down the methodology, but keep in mind, this is just one evenings worth of findings. I’ll update this page as I continue to back-test.
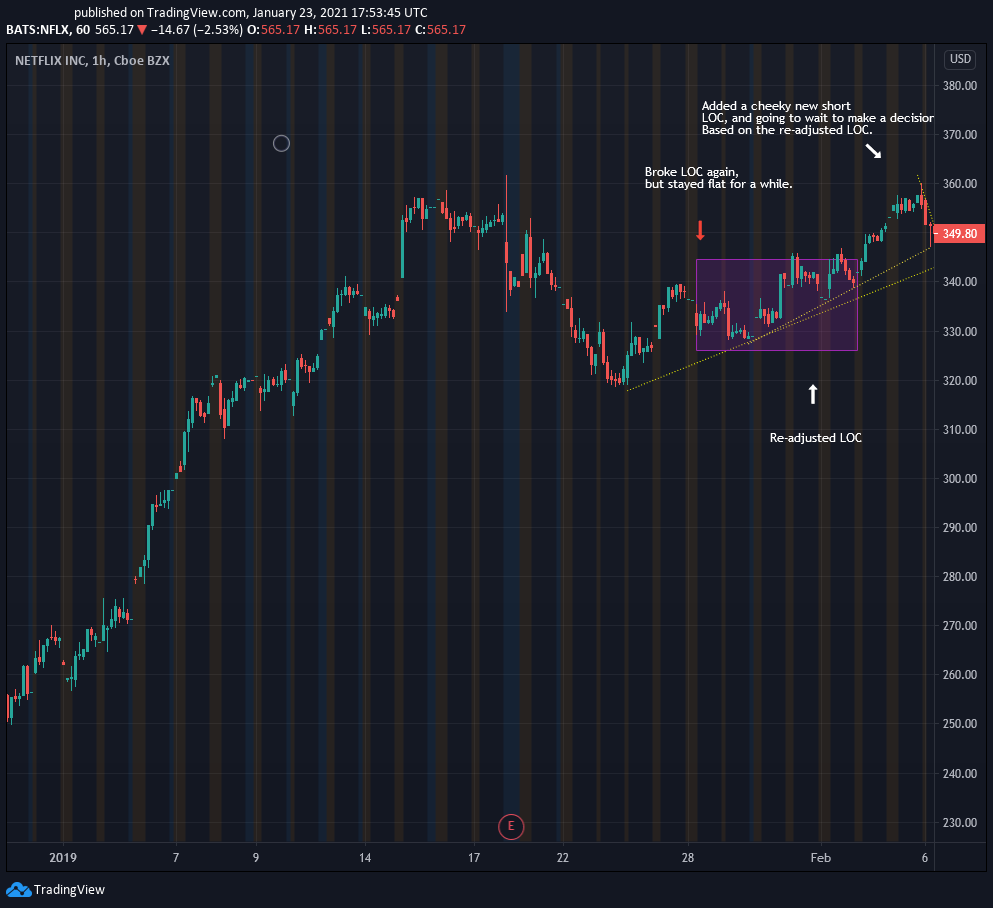
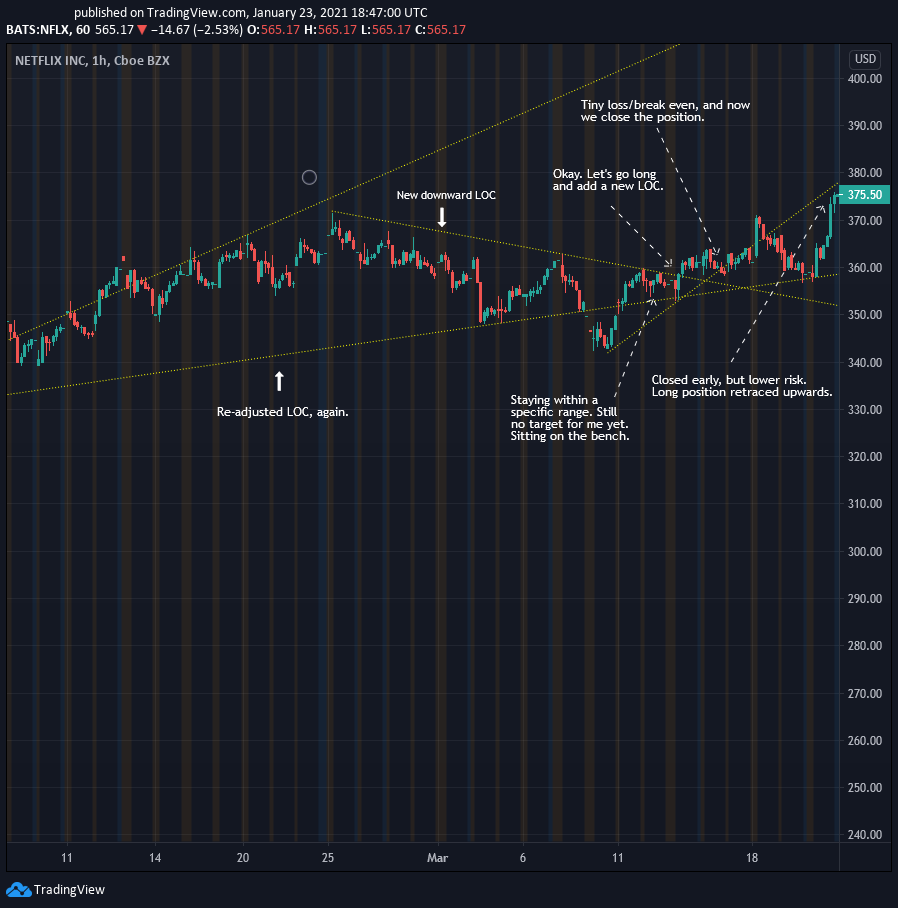
Below, we’ll start with an upward facting Line Of Change (LOC), point A to point B.
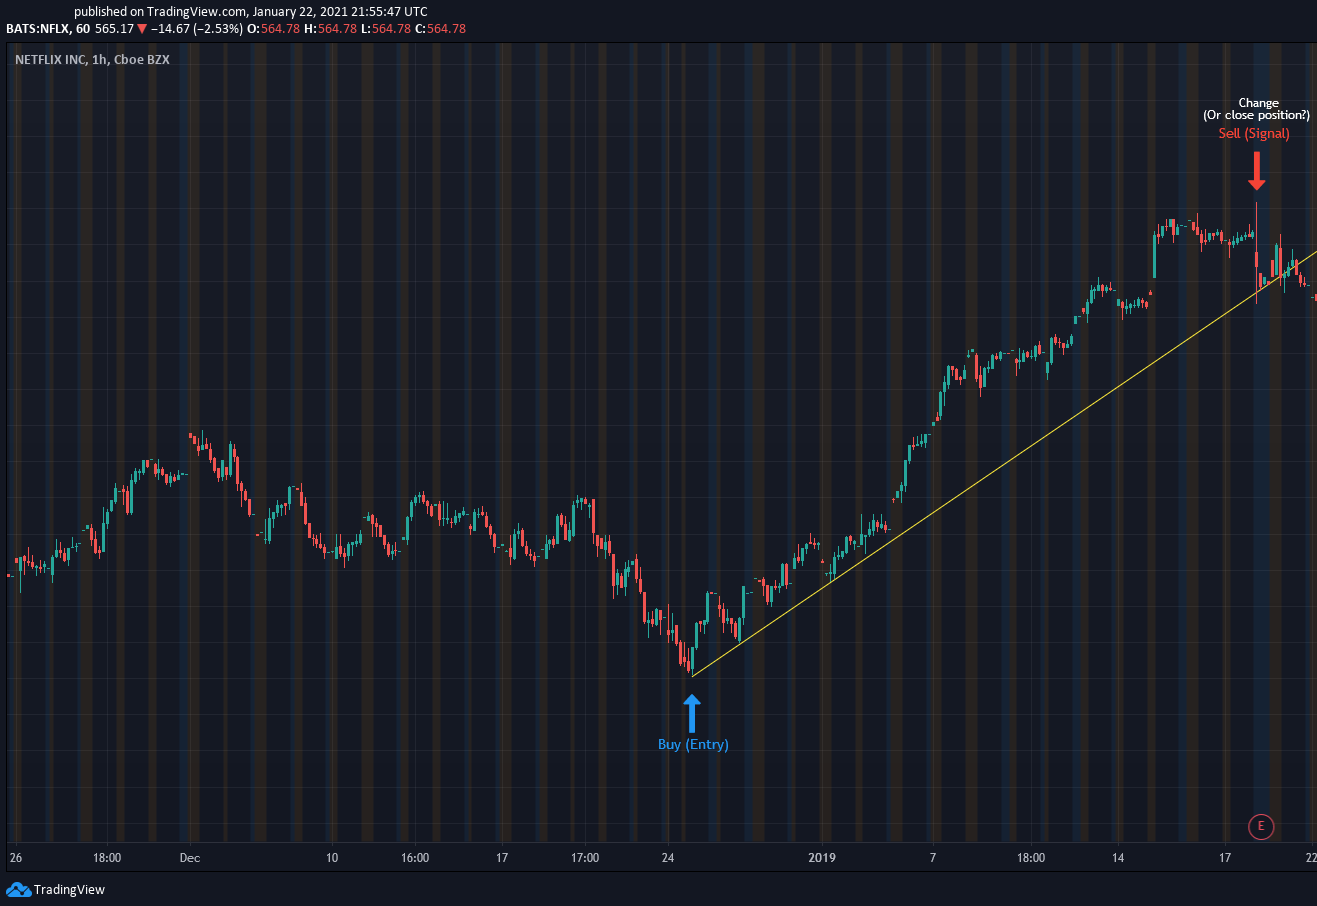
I took a (simulated) short position because price broke through our LOC. It’s similar to Support and Resistance, with some key differences. I added a downward tranding LOC above the break, shorted the stock, and closed once the price broke back through the LOC.
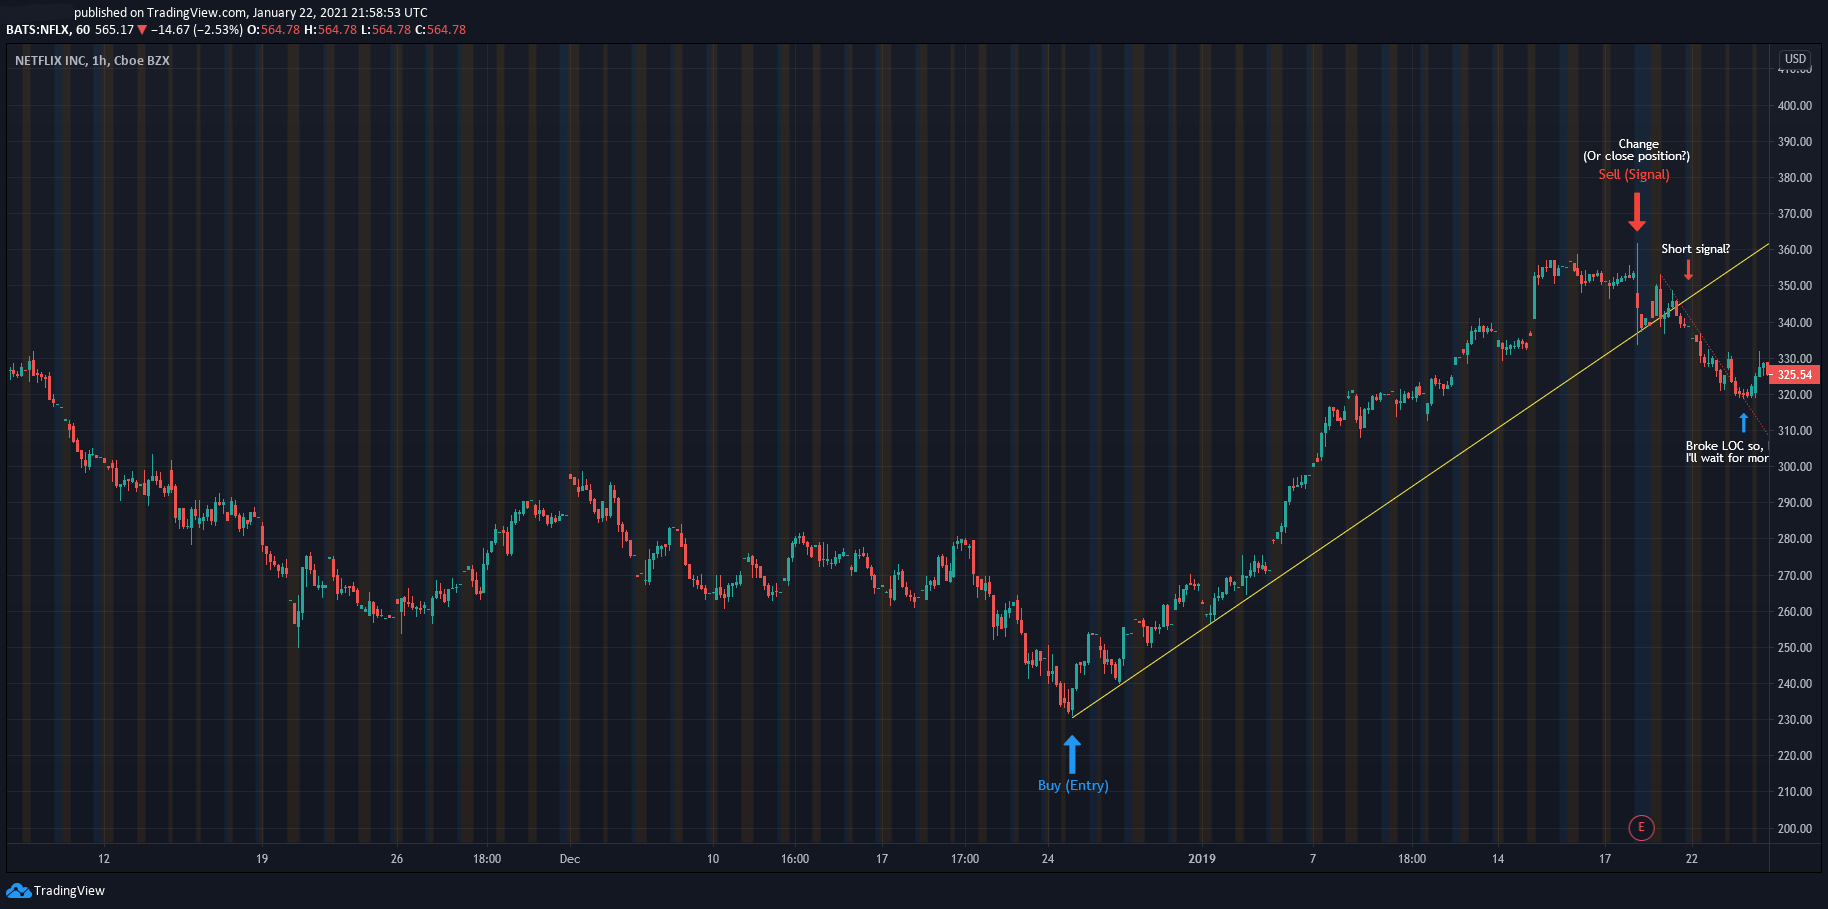
I sat on the fence about going long, and missed an opportunity, however the price consolidated within a range for a while before breaking off.
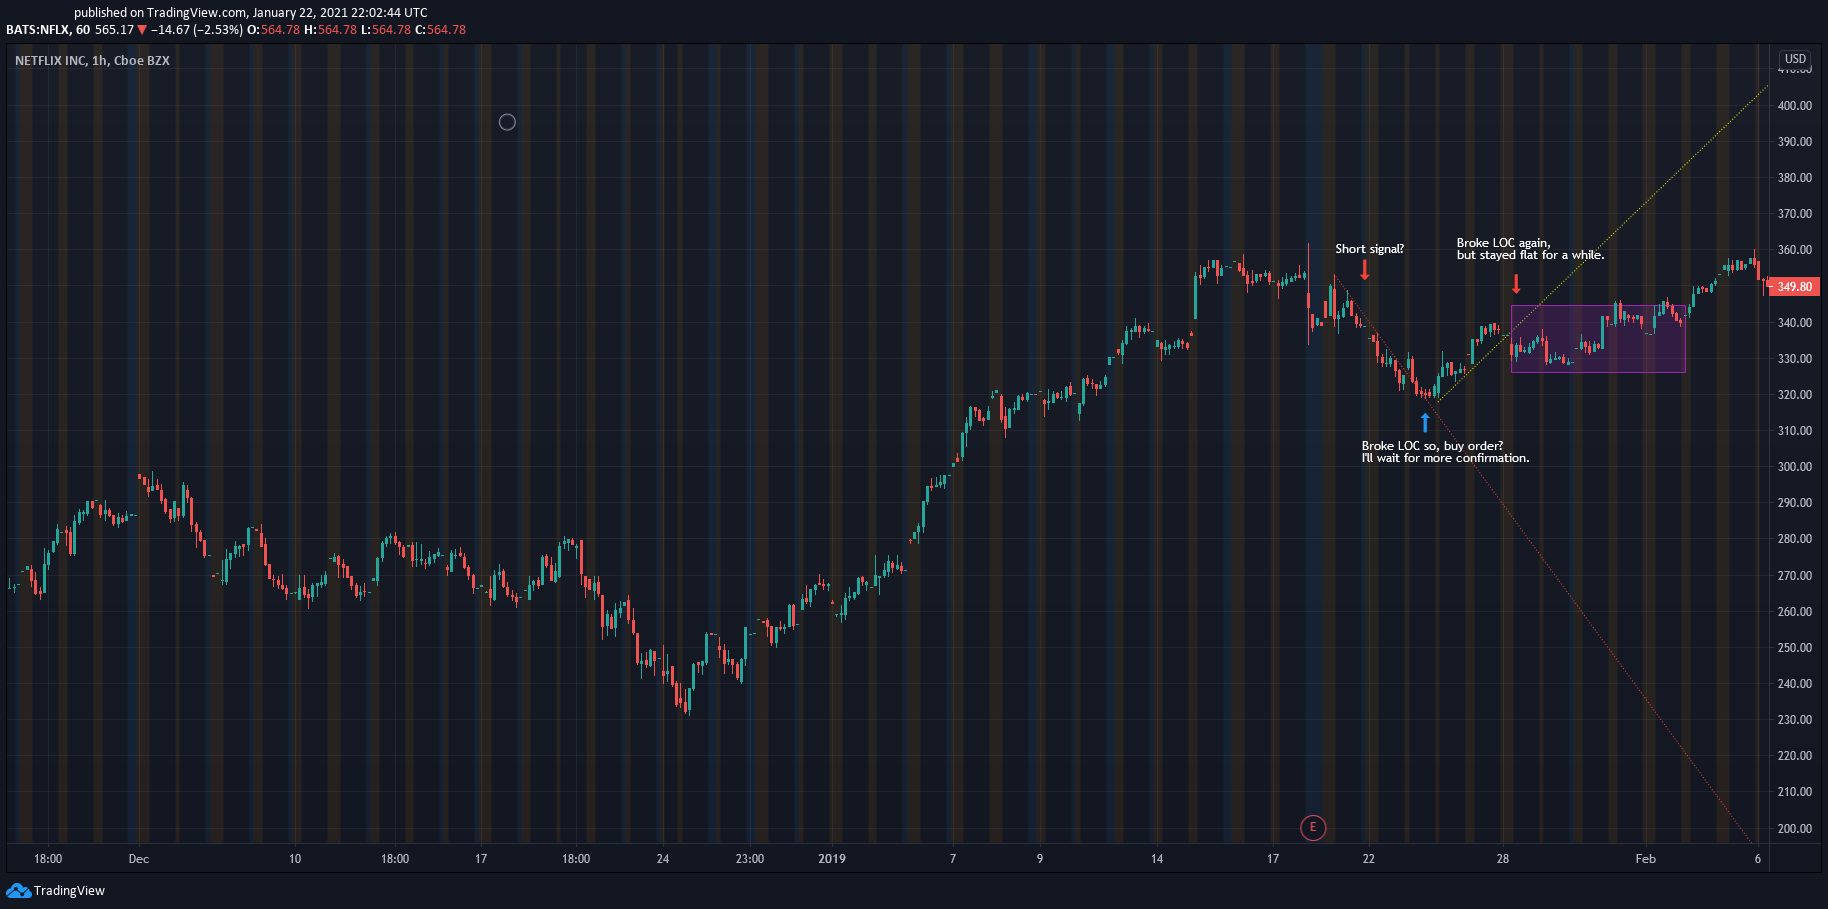
I re-adjusted my LOC to the new point B I could see, and waited.
Added a second, steeper LOC and a downward facing LOC.
Broke through the Downward LOC, so I went long.
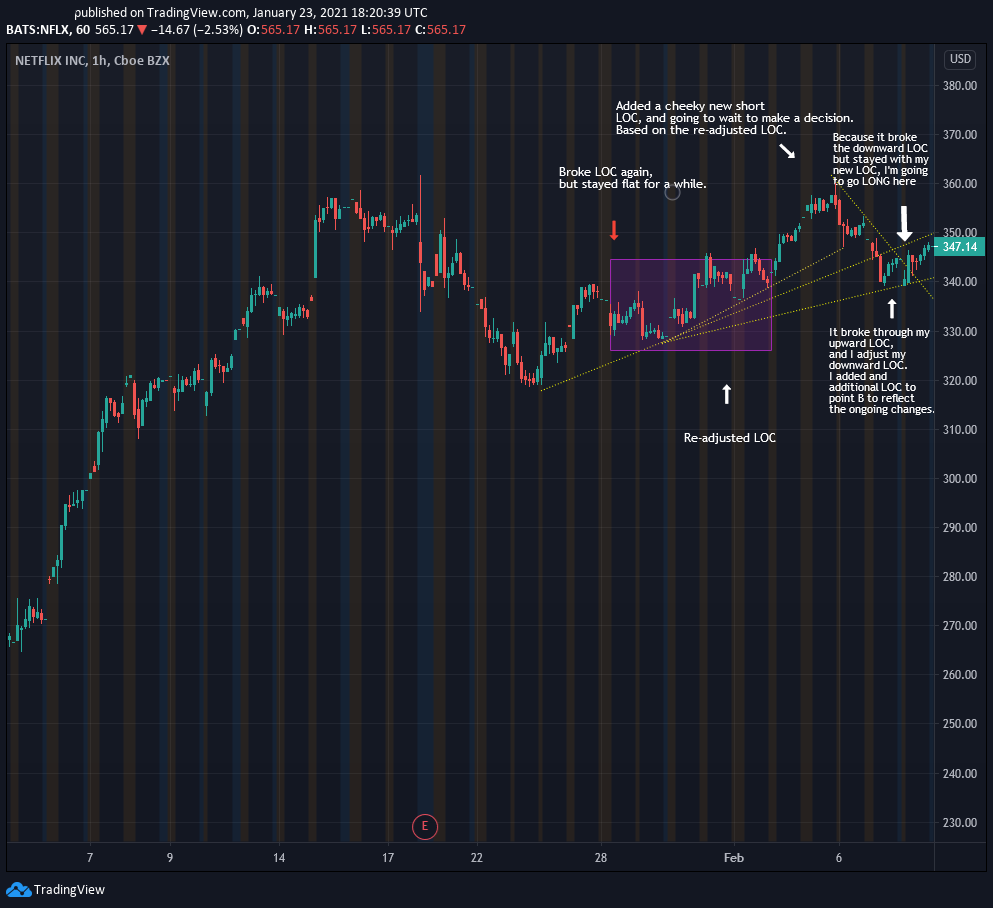
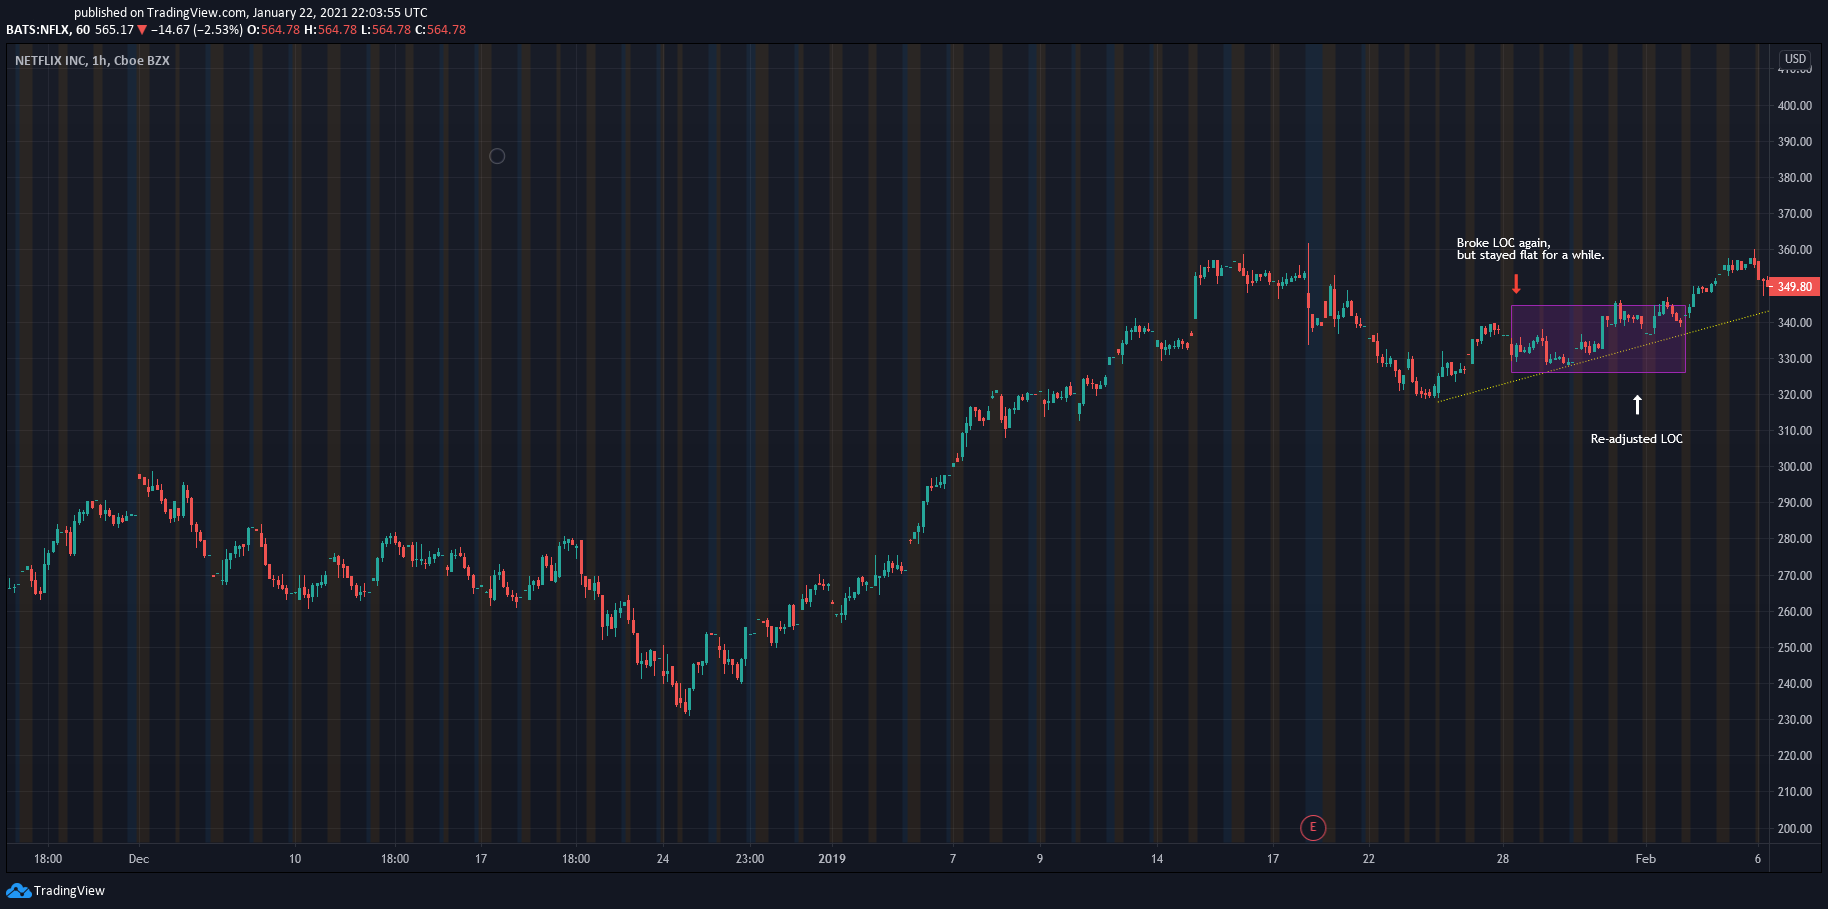
Good call. Tiny profit here for a very long but small upward trend. Closed it out once it went through the downward facing LOC.
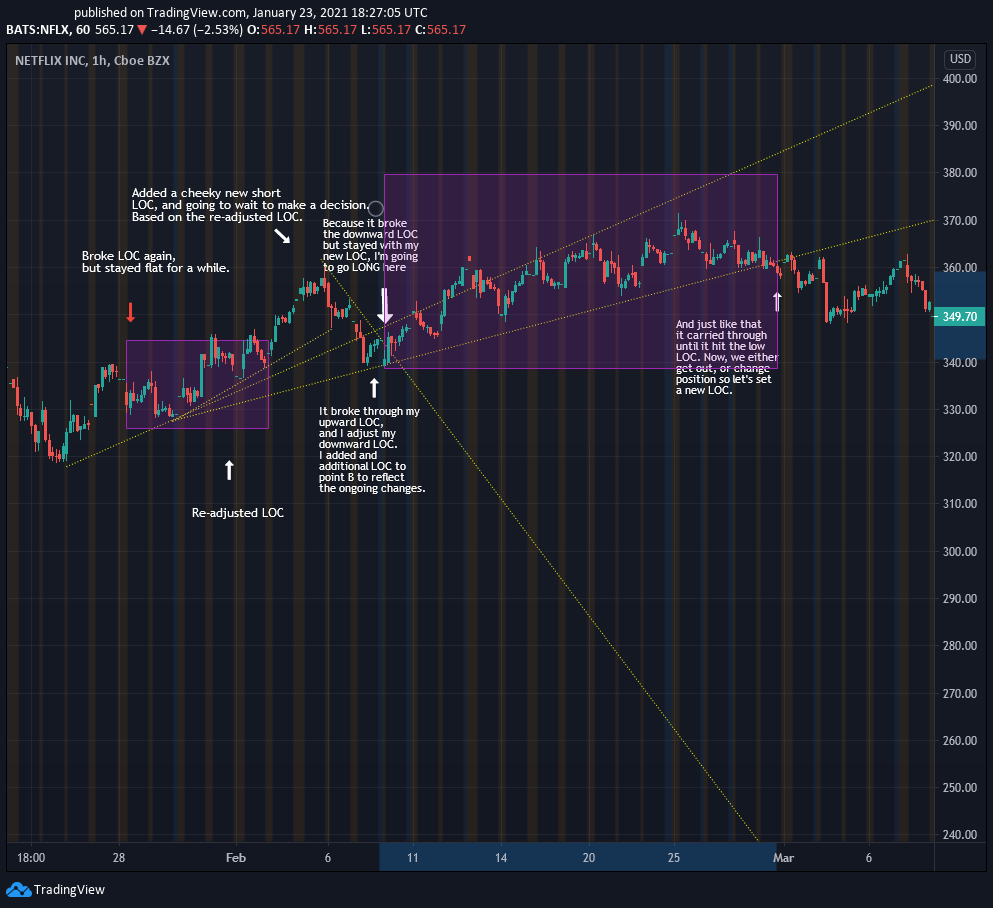
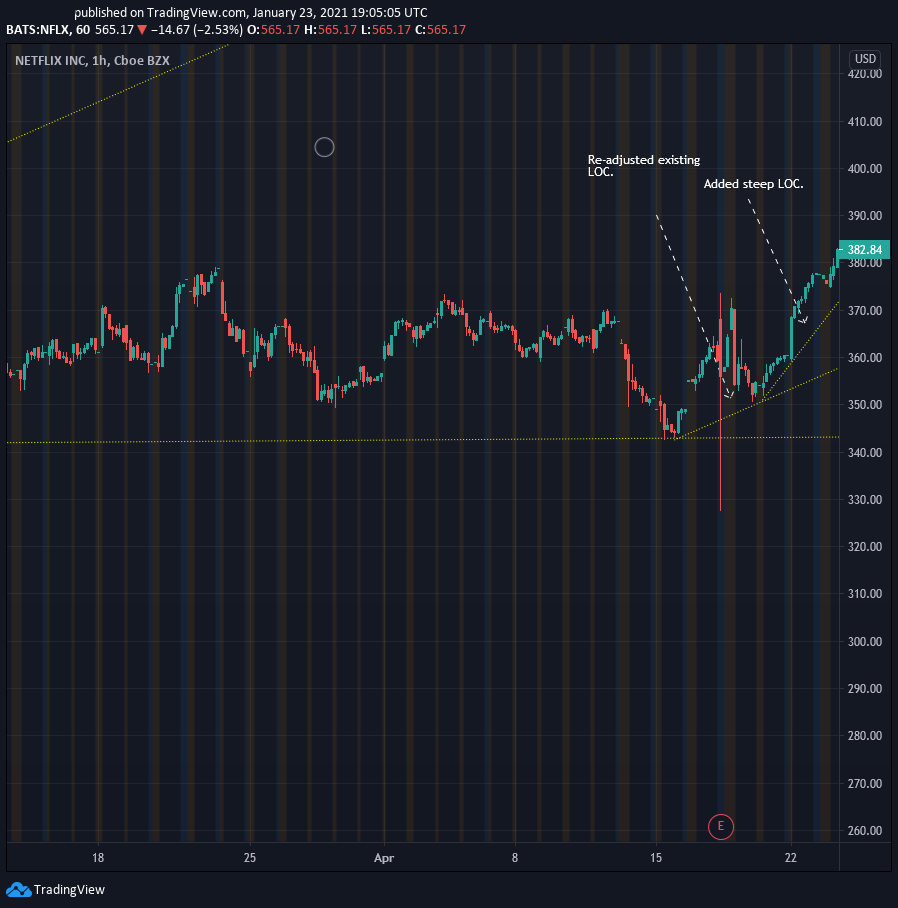
Removed consolidation box and added a new LOC. Re-adjusted existing LOC, sat on the bench for a while and then went for a LONG position.
Entered a little bit late, and exited a bit too early. Still, a good shout.
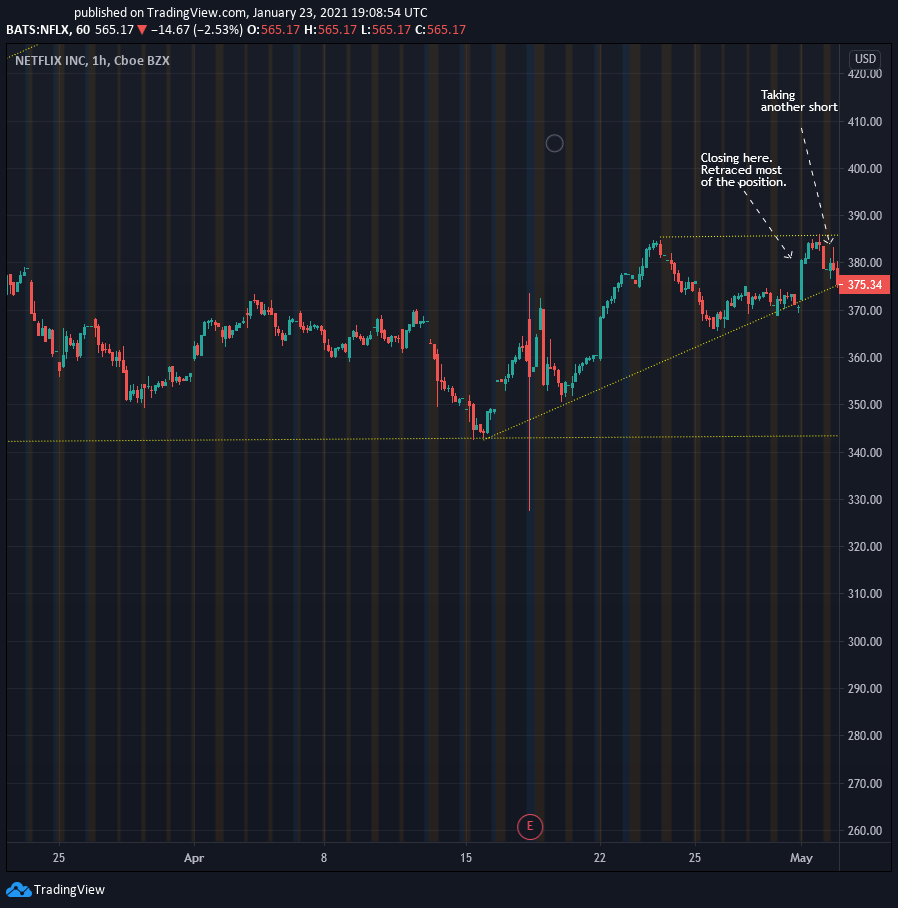
Okay, this chart is full of LOC’s and a little bit crowded, but it makes sense. The upward trend broke our downward LOC so I took a short position. Exited a little bit too late and took about 1% profit before it continued trending down. Jumped the gun.
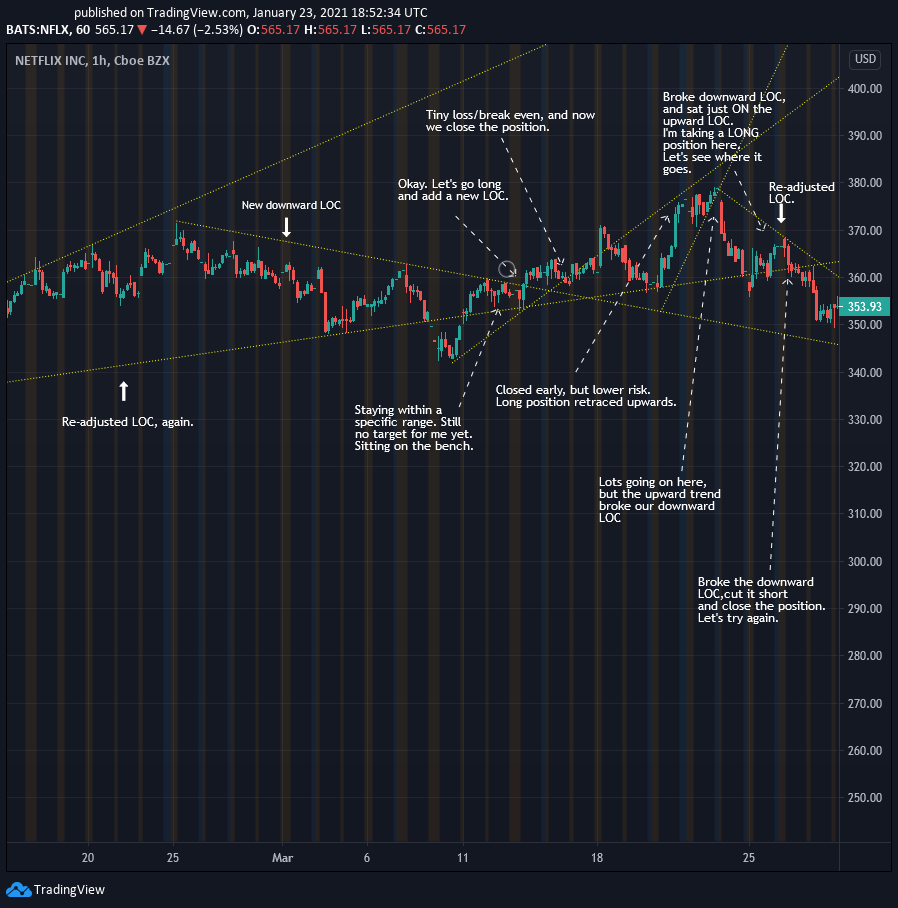
Cleared up the chart a little bit, re-adjust downward LOC and then noticed it broke the LOC going upward. Took a long position.
Entered late and exited early, again.
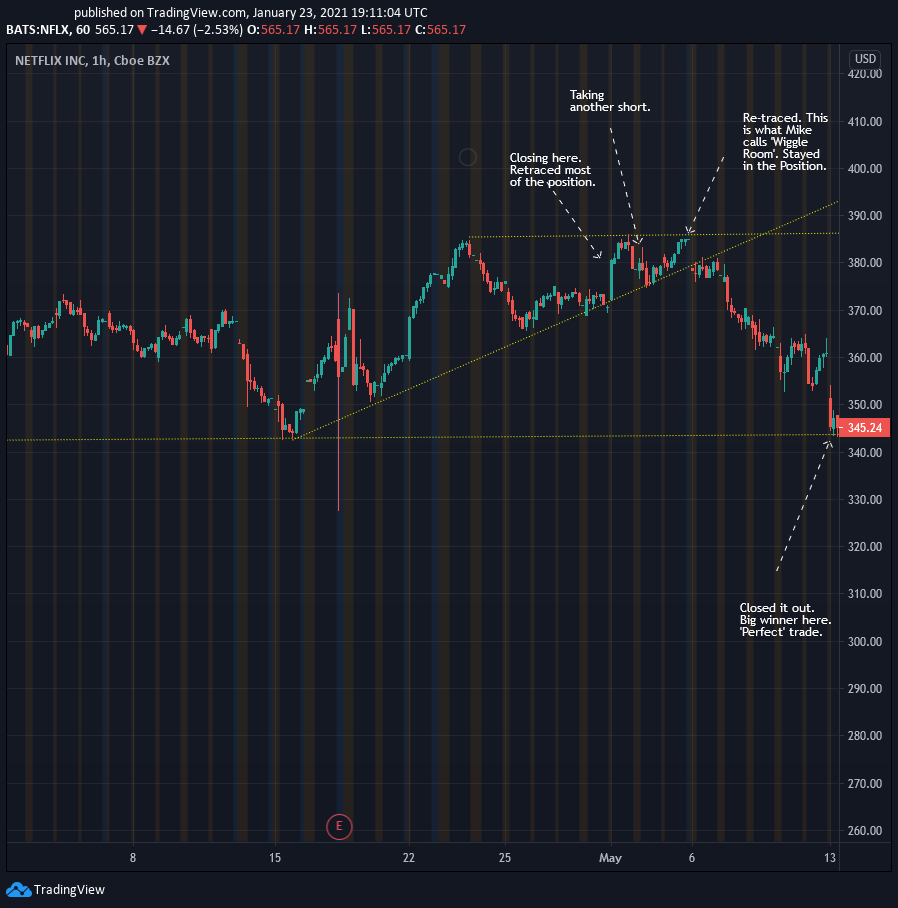
Need to start adding some wiggle room. Basically, a buffer to give the price some space before exiting out completely.
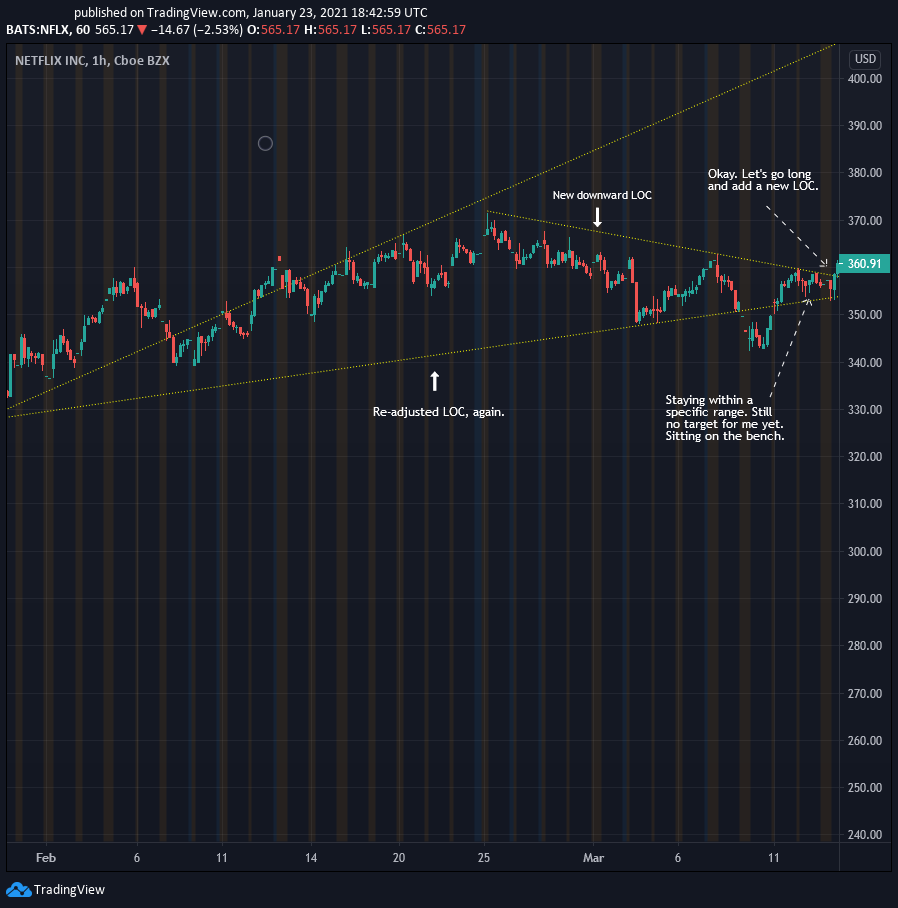
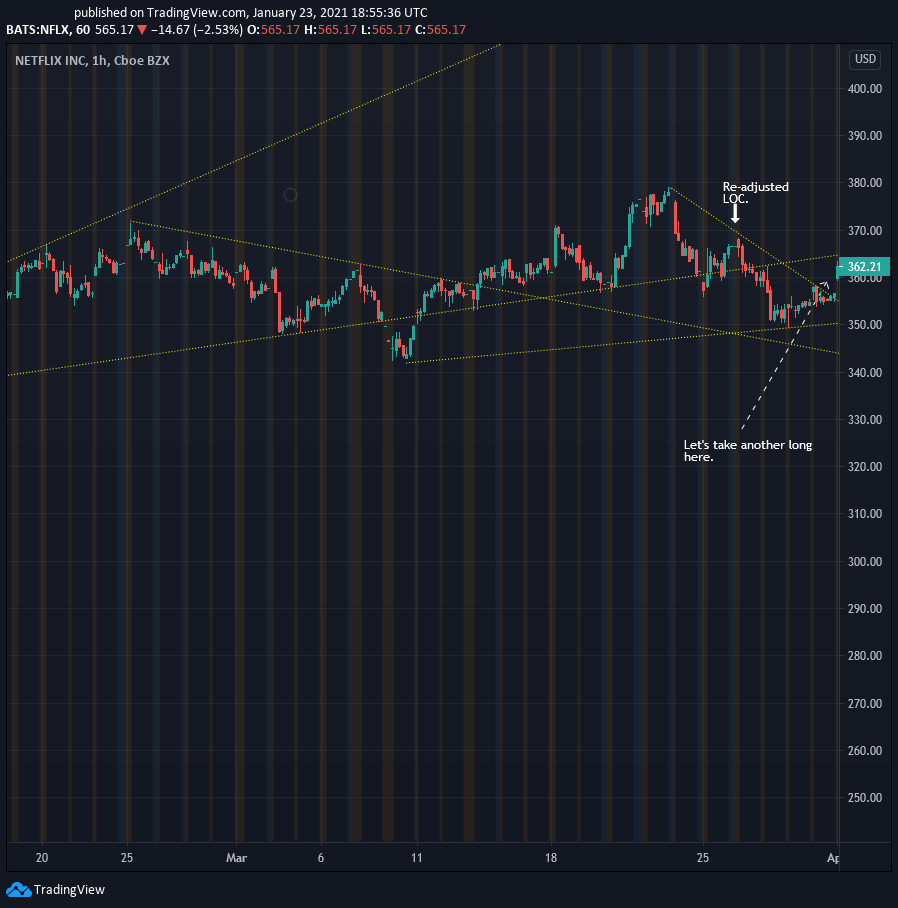
The price went flat and I adjusted the upward LOC. Price just broke the upward facing LOC and so, I premptively took a short position.
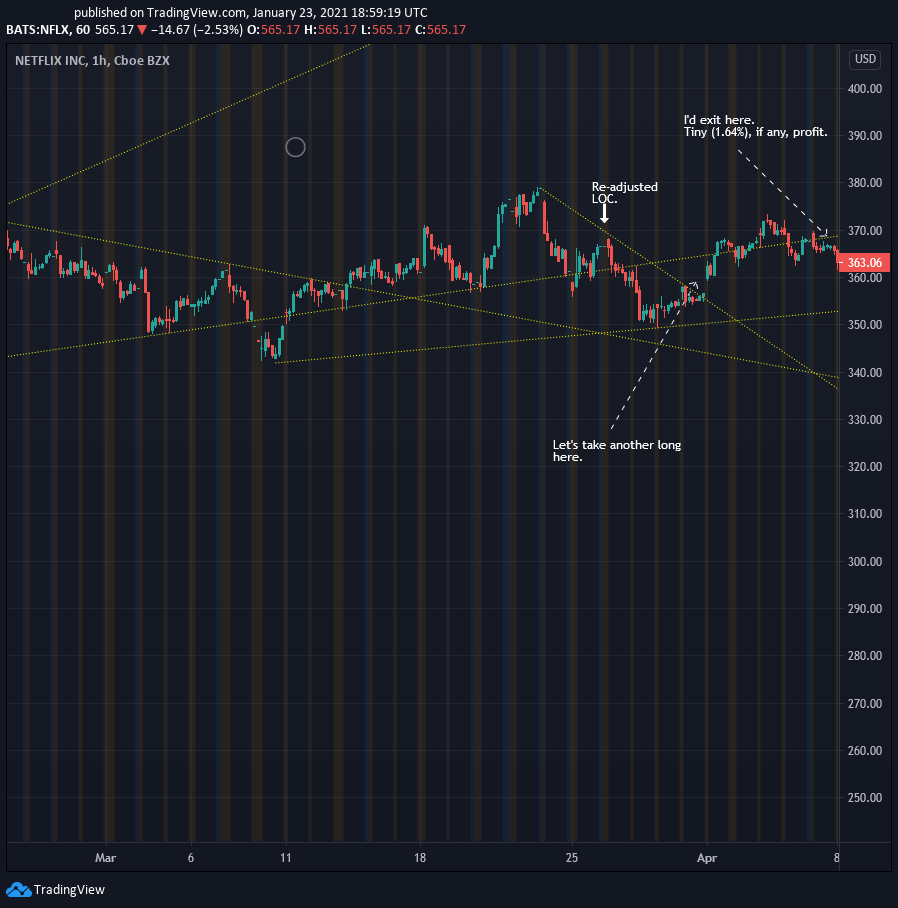
Looks like it paid off. Bagged a big downward trend and the setup was, in my opinion, perfect.
References:
Photo by Cristiano Temporin on Unsplash, Software by TradingView